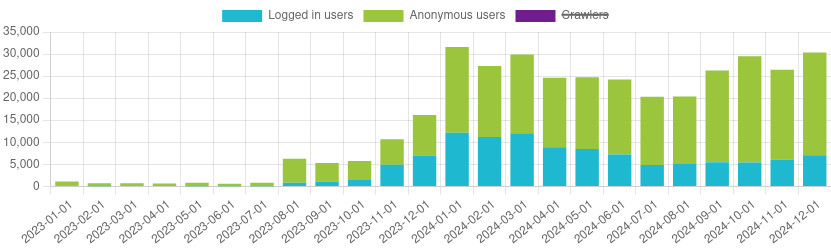
Apparently end of year site statistics is a thing. Here’s delving’s stats for daily logged in user visits, aggregated for each month, for the past two years.
data:
        - x: ['2023-01', '2023-02', '2023-05', '2023-06', '2023-07', '2023-08', '2023-09', '2023-10', '2023-11', '2023-12', '2024-01', '2024-02', '2024-03', '2024-04', '2024-05', '2024-06', '2024-07', '2024-08', '2024-09', '2024-10', '2024-11', '2024-12']
          y: [22, 5, 17, 26, 22, 148, 200, 293, 475, 831, 1536, 1482, 1671, 1545, 1486, 1407, 1149, 1106, 1238, 1266, 1251, 1315]
layout:
    title: "Monthly signed in user visits"
The site traffic report had an upgrade mid 2024 to better handle uninteresting automated traffic, but only the legacy version has consistent data going back more than six months. For whatever that’s worth, it looks like:
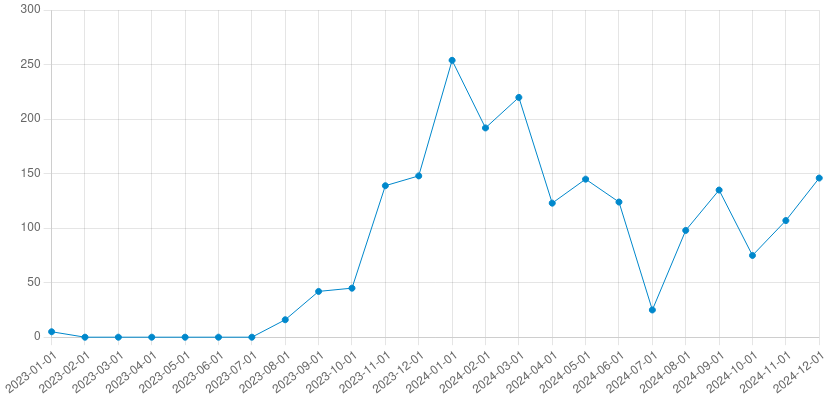
The number of new posts per month graph looks like: