This is a thread to discuss the memory usage of peers.
Interesting things:
- average case / expected memory usage per peer
- difference in average case memory usage for block-relay-only peer vs full-relay peer
- worst case memory usage for a single peer
- worst case memory usage for a block-relay-only peer vs full-relay peer
- how different network conditions impact the expected memory usage per peer
Memory monitoring:
- I have written a patch to monitor the memory usage of different types of connections. It currently reports (1) current
CNodememory usage (2) currentPeermemory usage & (3) maxPeermemory usage. - Status: the broad strokes are in place, but there are some fields that are not yet accounted for (details in PR description). Also, I would love review to know if the code actually does what I think it does!
- Desired improvement: update the max peer memory usage to incorporate
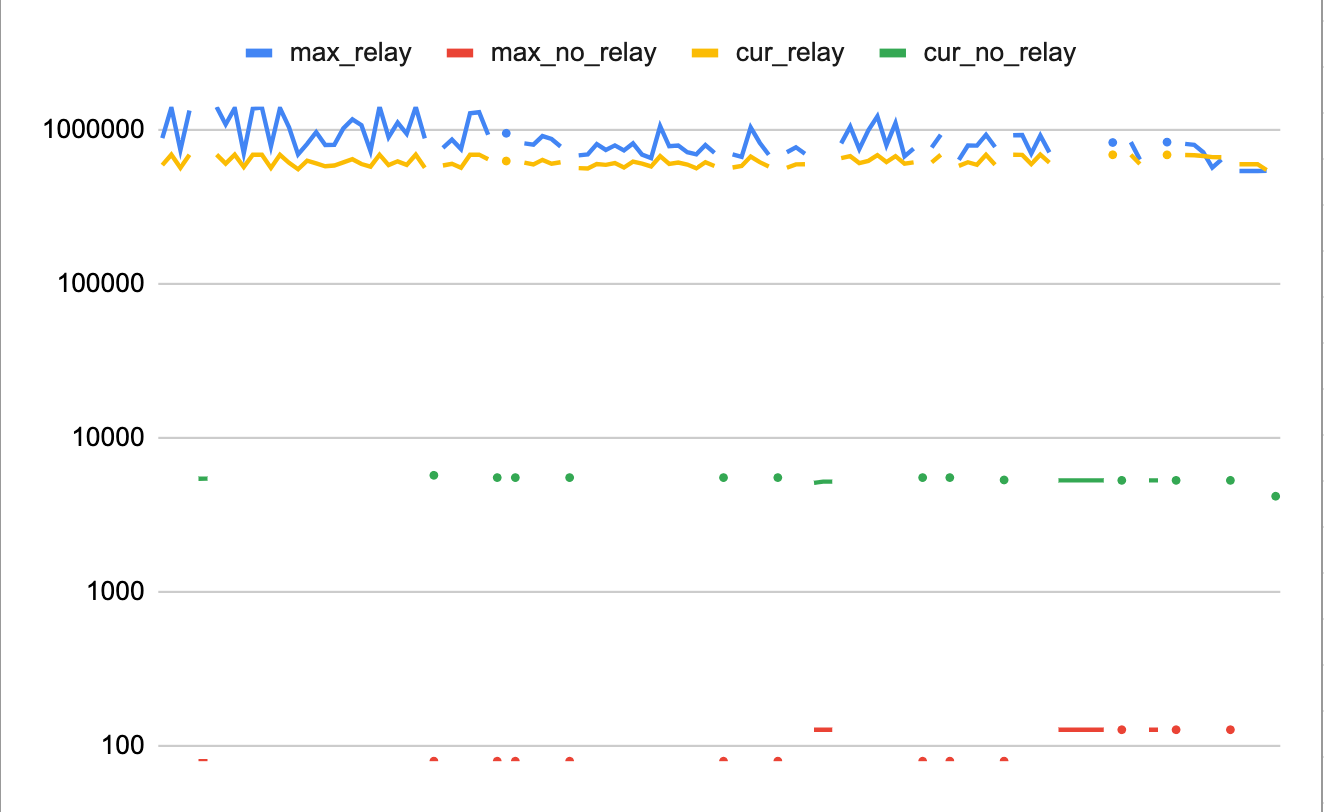
CNodememory, so it will be a better representation of the entire connection. - This spreadsheet are the results from running the patch on my node with inbounds enabled for approximately 5 days (nov 10-15). it shows a dramatic difference between the max memory usage of block-relay-only peers vs full-relay peers.
this graph shows memory usage broken down by max & current, for connections with relay enabled or not. y axis: number of bytes, x axis: different nodes.
Warnet:
Warnet can help us observe different network conditions. Here are some questions I’m curious about, where I think warnet can create/isolate behaviors we sometimes see:
- When LinkingLion is on the prowl, there is high churn of inbound connections. How much memory does each short-lived connections use?
- Especially with ordinals/transcriptions, we sometimes see really high transaction volume. How does that impact the expected/average memory usage of our full-relay connections?
Do you have more ideas? ![]()