Snapshot of the current yearly block prop graph:
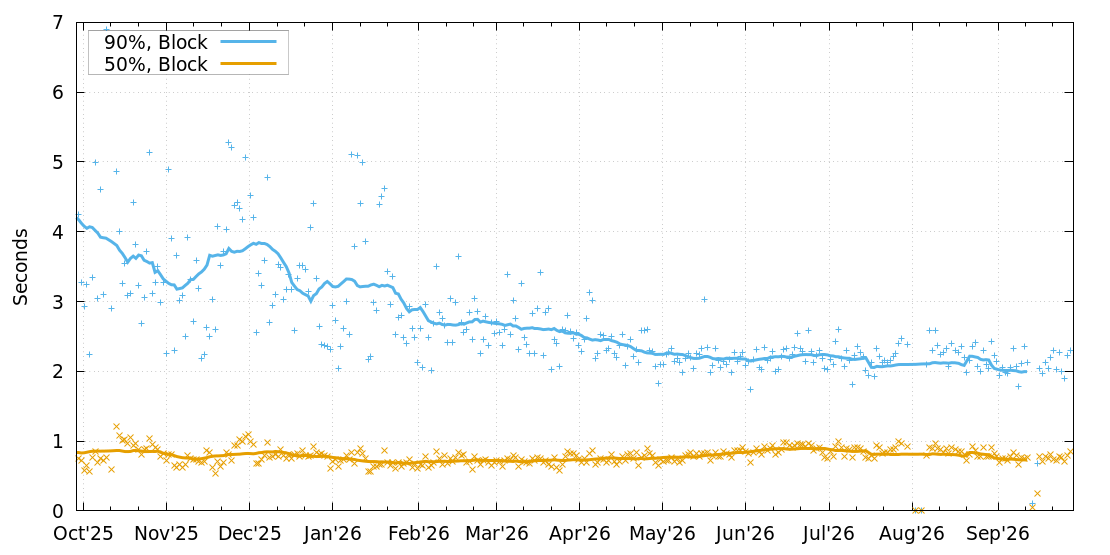
I think you’d expect correlation between block propagation and the “latency history” chart, which looks like it shows much worse latency figures at about the same time that compact block relay started consistently requiring round trips.
Snapshot of the latency graph:
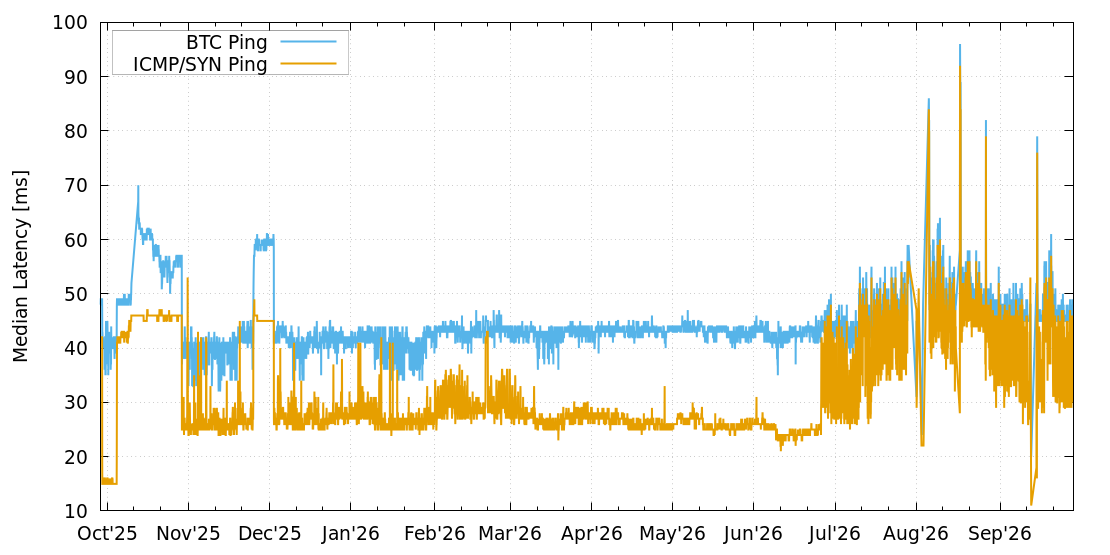
If we’re getting pings on the order of 30ms-40ms per the latency chart, then the round-trip for reconstruction adds about 40ms per hop for the round-trip plus also the time for the announcer to actually validate the block before it will provide the txs, which might be anywhere between an additional 50ms to 300ms? It’s probably only about two hops from a well-connected node to get to 50% of the network, so I guess I’d expect some increase but not much of one.
The steady decrease on the 90% block propagation chart doesn’t seem like it has an obvious protocol-level justification to me. It could be due to validation time improvements, or node hardware upgrades, or perhaps that transactions happen to be using cached utxos more often. It could also be a reflection of the network becoming more centralised – for sybil nodes, getting a block to just one of them gets a block to all of them, eg; so a higher percentage of sybil nodes would likely equate to faster propagation.
OTOH, I guess the 90% decrease roughly coincides with localhost’s FIBRE network relaunch, announced in Feb 2026? Not sure why that would be a fairly steady decrease rather than a step function though.